2  Missingness generation

Details on how mice::ampute imposes missingness

Author

Janick Weberpals

Published

November 1, 2024

2.1 Objective

In this section, we detail the process with which the mice::ampute function is used to impose missingness on one or multiple pre-specified variables. For this example, let…

  • \(X\) be a binary exposure
  • \(Y\) be a time-to-event outcome with the follow-up time until event or censoring (eventtime) and event indicator (status)
  • \(Z2\) be continuous confounder
  • \(U\) be a binary prognostic factor (associated with outcome but not exposure)

We also simulate all other covariates of the substantive model with their approximate distributions as observed in the empirical claims-EHR linked dataset.

Show the code
source(here::here("functions", "generate_data.R"))

cohort <- generate_data(
  seed = 42, 
  n_total = n_total
  )

#| label: tbl-tbl1
#| tbl-cap: "Covariate distributions by exposure."

cohort |> 
  select(-c(eventtime, status)) |> 
  tbl_summary(by = X) |> 
  add_difference()
Characteristic 0, N = 8061 1, N = 1,6941 Difference2 95% CI2,3 p-value2
Z2 0.86 (0.69, 1.02) 0.81 (0.66, 0.97) 0.04 0.02, 0.06 <0.001
U 106 (13%) 332 (20%) -6.4% -9.5%, -3.4% <0.001
c_ed 0.99 (-0.98, 3.10) 0.94 (-0.42, 2.34) 0.09 -0.14, 0.32 0.5
c_gnrc_cnt 10.1 (6.3, 13.3) 11.1 (7.6, 14.4) -1.2 -1.7, -0.80 <0.001
c_flu_vaccine 517 (64%) 1,048 (62%) 2.3% -1.9%, 6.4% 0.3
c_foot_ulcer 16 (2.0%) 75 (4.4%) -2.4% -3.9%, -0.98% 0.003
c_glaucoma_or_cataract 415 (51%) 860 (51%) 0.72% -3.6%, 5.0% 0.8
c_ischemic_stroke 74 (9.2%) 243 (14%) -5.2% -7.9%, -2.5% <0.001
c_h2ra 65 (8.1%) 122 (7.2%) 0.86% -1.5%, 3.2% 0.5
c_acei 270 (33%) 545 (32%) 1.3% -2.7%, 5.4% 0.5
c_arb 123 (15%) 291 (17%) -1.9% -5.1%, 1.2% 0.3
c_statin 476 (59%) 942 (56%) 3.4% -0.78%, 7.7% 0.11
c_spironolocatone 14 (1.7%) 32 (1.9%) -0.15% -1.4%, 1.1% >0.9
dem_age 75 (70, 80) 76 (71, 81) -0.77 -1.4, -0.15 0.014
1 Median (IQR); n (%)
2 Welch Two Sample t-test; Two sample test for equality of proportions
3 CI = Confidence Interval

Let’s further assume that we want to simulate missingness only in \(Z2\). The corresponding missingness indicator for \(Z2\) is denoted as \(M_{Z2}\).

Generally, the mice::ampute allows to simulate complex multivariate missingness patterns and mechanisms. For example, multiple different patterns with different underlying frequencies/prevalences and missingness mechanisms can be simulated. Pattern in this context if defined as a combination of missingness on specific variables while other variables remain complete.

For this example, we just consider a single missingness pattern for \(M2\), for which, simply speaking, the probability for \(M_{Z2}\) is imposed using the covariate values Z2 and U.

\[Pr(M_{Z2}|Z2,U) = Z2 + U\] The detailed steps are illustrated in the following.

2.2 Step 1: Assigning a missingness pattern

In a first step, we assign the missingness pattern. To that end, we create a vector with the length of the number of covariates that denotes which covariates should be become partially missing (denoted by a value of 0) and which should remain complete (denoted by a value of 1).

Show the code
# define column numbers for pattern and weight determination
col_Z2 <- which(colnames(cohort) %in% "Z2")
col_U <- which(colnames(cohort) %in% "U")

# define missingness pattern
default_pattern <- rep(1, ncol(cohort))
pattern <- replace(default_pattern, col_Z2, 0)

tibble(
  Variable = colnames(cohort),
  Pattern = pattern
  ) |> 
  gt()
Table 2.1: Assigned missingness pattern matrix.
Variable Pattern
X 1
Z2 0
U 1
c_ed 1
c_gnrc_cnt 1
c_flu_vaccine 1
c_foot_ulcer 1
c_glaucoma_or_cataract 1
c_ischemic_stroke 1
c_h2ra 1
c_acei 1
c_arb 1
c_statin 1
c_spironolocatone 1
dem_age 1
eventtime 1
status 1

As you can see, only \(Z2\) was assigned a value of 0, indicating that we will impose missing only on this covariate.

2.3 Step 2: Assigning weights

For MAR and MNAR mechanisms, the probability of an individual \(i\) to have an observed or missing \(Z2\) is calculated using a weighted sum score. This calculation depends on the values of covariates which we define as predictors to impose missingness on \(Z2\) as well as pre-specified weights which are manipulated by the user through a vector or matrix. To that end, predictors will be assigned a non-zero value which indicates the weight this variable receives. For example, if \(Z2 = 2\) and \(U = 1\), \(Z2's\) influence would be twice as large as \(U's\) influence. The scale here is relative, which means that \(Z2 = 2\) and \(U = 1\) would be the same as \(Z2 = 0.2\) and \(U = 0.8\).

In this example, we assign weights of 0.2 and 0.8 to \(Z2\) and \(U\), respectively, which means that \(U\) has a larger weight.

Show the code
default_weights <- rep(0, ncol(cohort))

# replace the predictor columns with a 1 or non-zero value
weights <- replace(default_weights, c(col_Z2, col_U), c(0.2, 0.8))

tibble(
  Variable = colnames(cohort),
  Weights = weights
  ) |> 
  gt()
Table 2.2: Assigned missingness weights matrix.
Variable Weights
X 0.0
Z2 0.2
U 0.8
c_ed 0.0
c_gnrc_cnt 0.0
c_flu_vaccine 0.0
c_foot_ulcer 0.0
c_glaucoma_or_cataract 0.0
c_ischemic_stroke 0.0
c_h2ra 0.0
c_acei 0.0
c_arb 0.0
c_statin 0.0
c_spironolocatone 0.0
dem_age 0.0
eventtime 0.0
status 0.0

2.4 Step 3: Computing a (scaled) weighted sum score (wss)

The way mice::ampute eventually computes the probability of an individual \(i\) to have an observed or missing \(Z2\) is calculated using a weighted sum score.

mice::ampute documentation: A weighted sum score is simply the outcome of a linear regression equation where the coefficients are the values of the weights matrix. When data row i is a candidate for pattern k, the weighted sum score is therefore: \[\begin{equation*} wss_i = w_{k,1} \cdot y_{1,i} + w_{k,2} \cdot y_{2,i} + ... + w_{k,m} \cdot y_{m,i}, \end{equation*}\]

where \({y_{1,i},y_{2,i},...,y_{m,i}}\) is the set of variable values of case i and \({w_{k,1},w_{k,2},...,w_{k,m}}\) are the pre-specified weights on row k of the weights matrix.

In our example, m=2 and k∈{1} because there are two variable \(Z2\) and \(U\) with a single missing data pattern.

The weighted sum score is additionally scaled using the scale function.

\[wss_{scaled} = \frac{wss - \bar{wss}}{sd_{wss}}\]

2.5 Step 4: Converting wss to probabilities

2.5.1 Discrete probabilities based on continuous weighted sum score quantiles

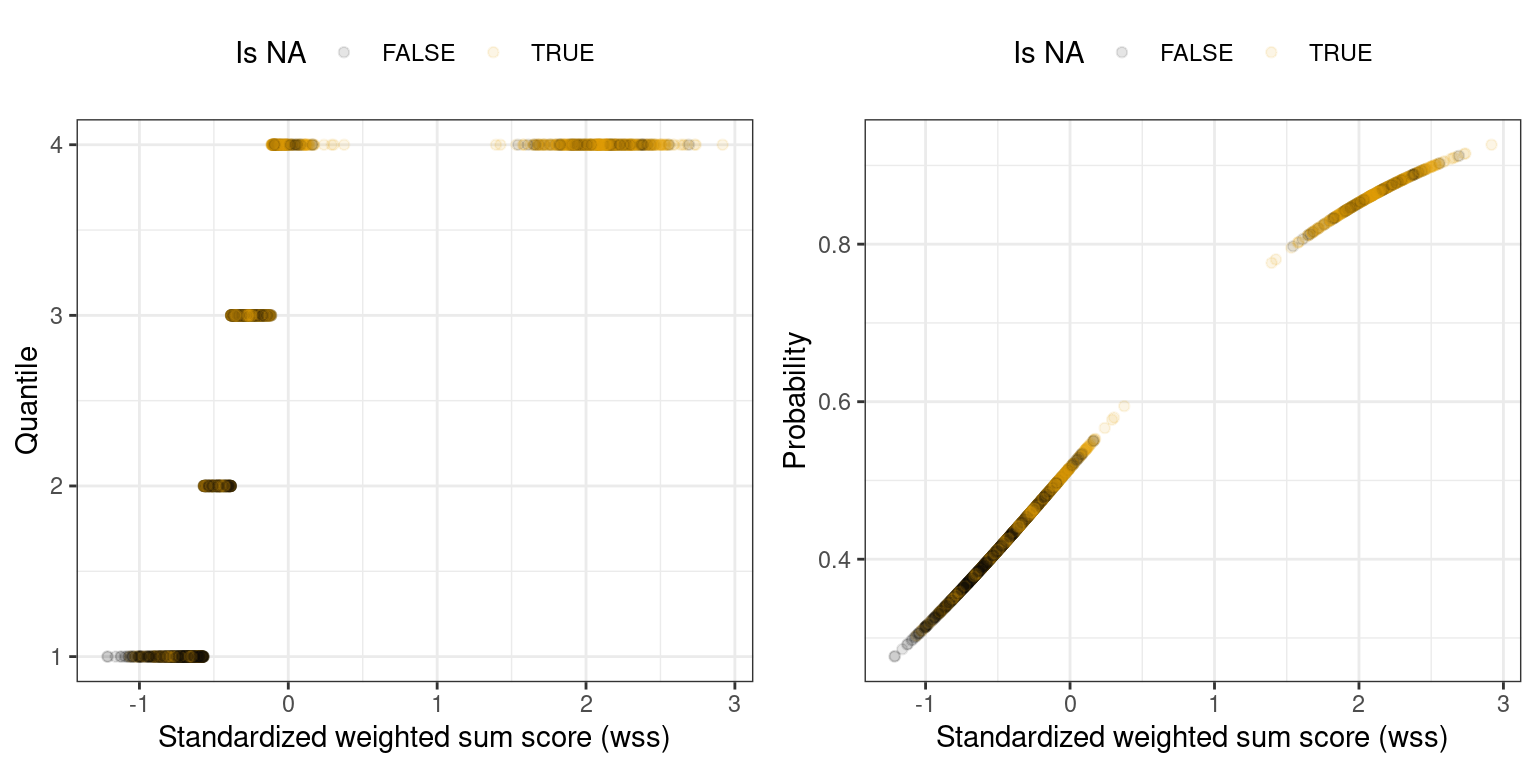
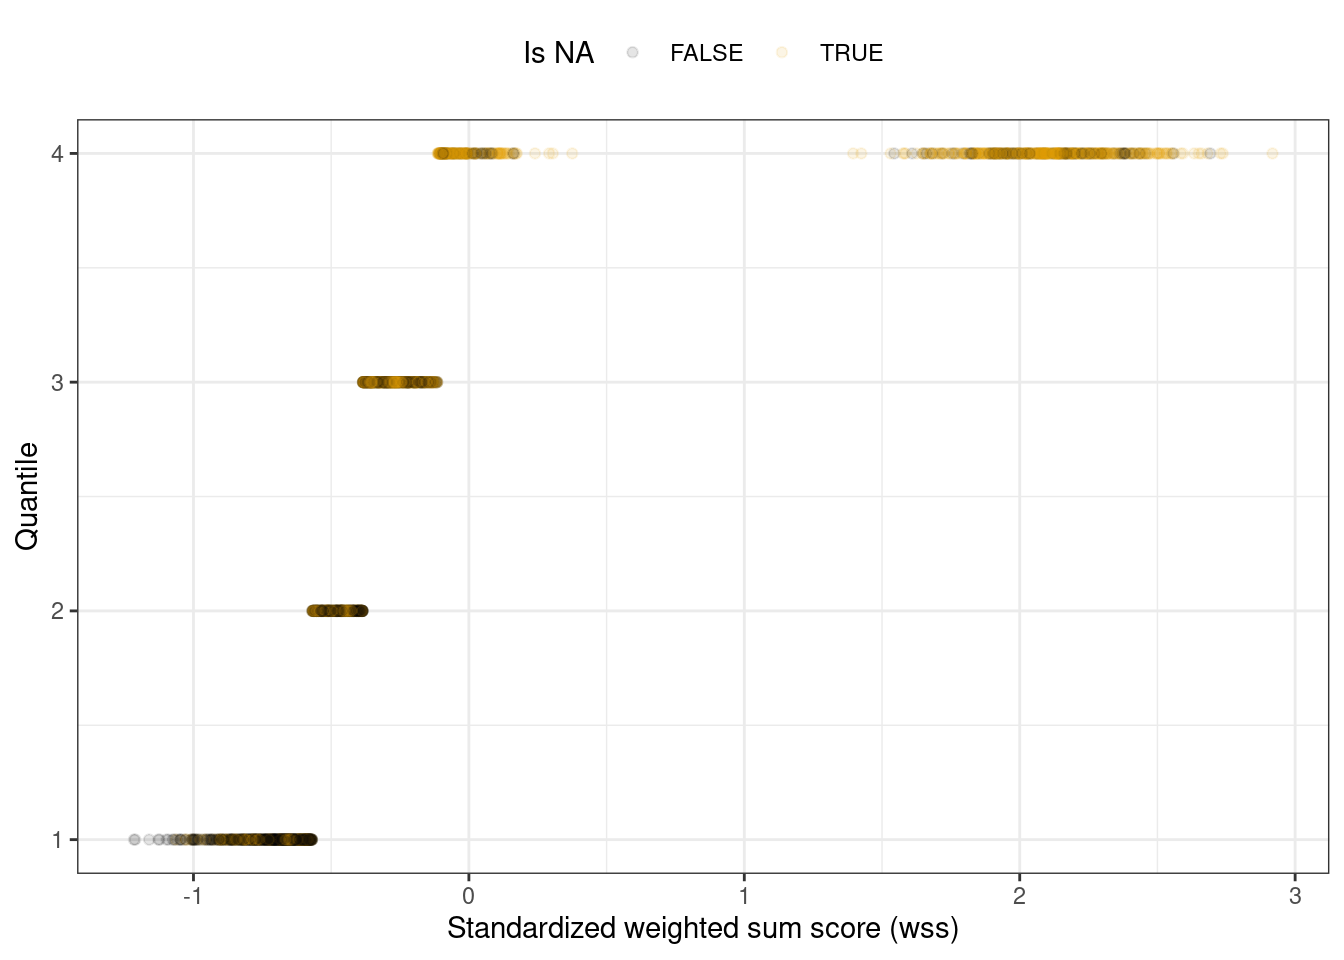
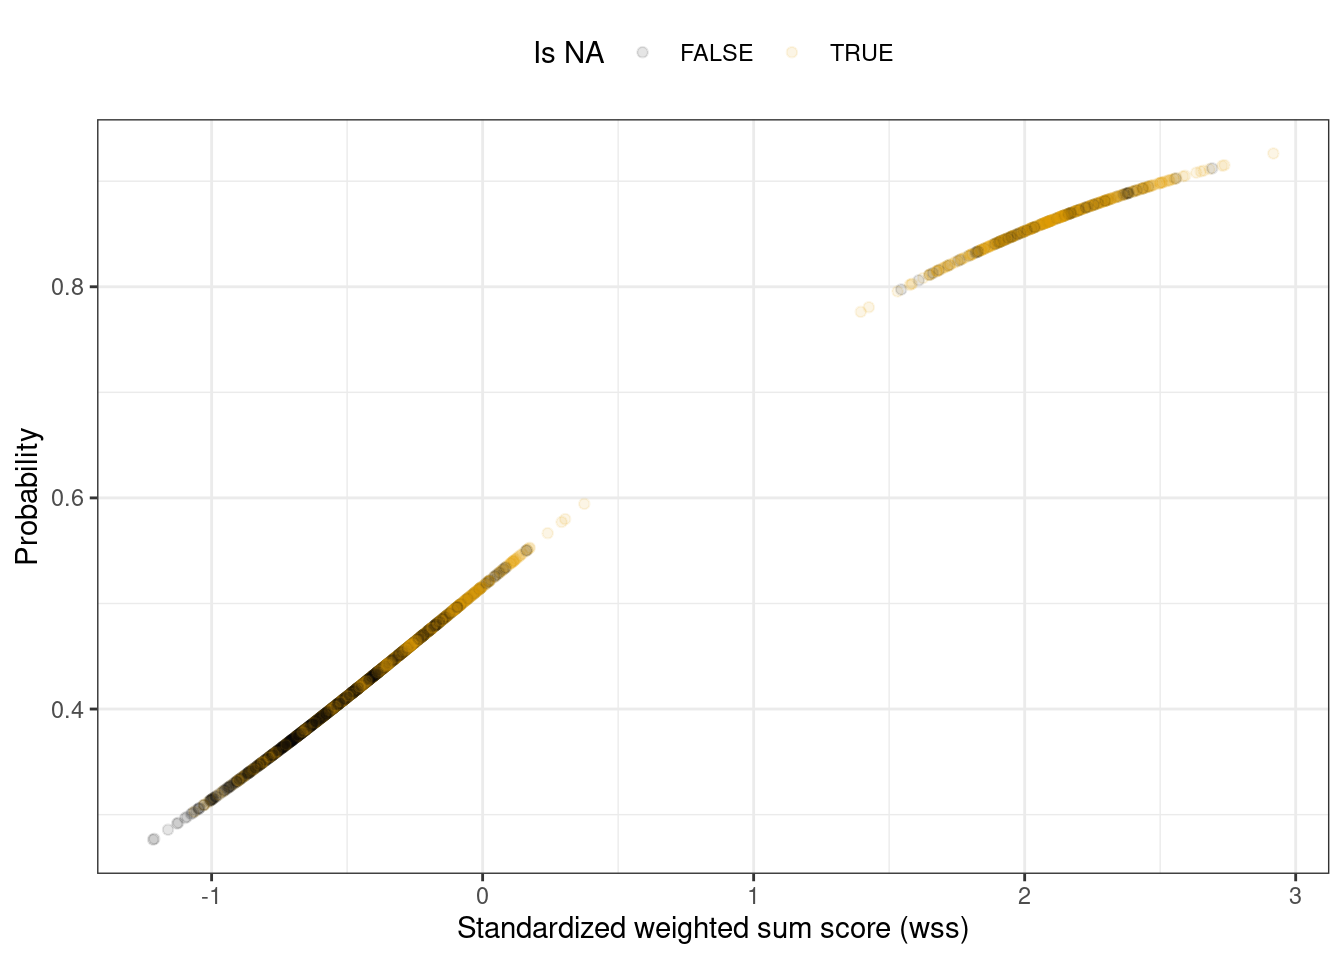
An alternative to using the ampute() default different logistic probability distributions to map the weighted sum scores to a missingness probablity is to use discrete probabilities as described in Brand (1999, pp. 110-113). The weighted sum scores of all patients are divided over a certain number of equally sized groups, or quantiles. An odds value defines the relative probability of each quantile group of becoming incomplete. In the following example, the weighted sum scores are divided over 4 groups/quantile with the highest quantile having a four-fold odds of having a missing value for \(Z2\).

Show the code
# replace the predictor columns with a 1 or non-zero value
odds <- c(1, 2, 3, 4)

set.seed(42)
data_miss <- mice::ampute(
  data = cohort,
  prop = 0.5,
  mech = "MAR",
  patterns = pattern,
  weights = weights,
  bycases = TRUE,
  cont = FALSE,
  odds = odds
  )

wss <- cohort |> 
  mutate(wss = unlist(data_miss$scores)) |> 
  mutate(quantile = ntile(x = wss, n = 4)) |> 
  mutate(isNA = is.na(data_miss$amp$Z2))

quantile <- ggplot(wss, aes(x = wss, y = quantile, color = factor(isNA))) +
  geom_point(alpha = 0.1) +
  labs(
    x = "Standardized weighted sum score (wss)", 
    y = "Quantile",
    color = "Is NA"
    ) +
  theme_bw() +
  scale_color_colorblind() +
  theme(legend.position = "top")

quantile
Figure 2.1: Imposed missingness based on scaled weighted sum score and corresponding quantile membership.
Show the code
odds_fit <- glm(
  isNA ~ wss,
  data = wss,
  family = "binomial"
  )

wss <- wss |> 
   mutate(probabilities = fitted(odds_fit))

probability <- ggplot(wss, aes(x = wss, y = probabilities, color = factor(isNA))) +
  geom_point(alpha = 0.1) +
  labs(
    x = "Standardized weighted sum score (wss)", 
    y = "Probability",
    color = "Is NA"
    ) +
  theme_bw() +
  scale_color_colorblind() +
  theme(legend.position = "top")

probability
Figure 2.2: Imposed missingness based on scaled weighted sum score and corresponding missingness probability.
Show the code
library(cowplot)

Attaching package: 'cowplot'
The following object is masked from 'package:ggthemes':

    theme_map
Show the code
plot_grid(quantile, probability)
Figure 2.3: Combined figures.

2.6 Session info

Script runtime: 0.09 minutes.

Show the code
pander::pander(subset(data.frame(sessioninfo::package_info()), attached==TRUE, c(package, loadedversion)))
  package loadedversion
arrow arrow 14.0.0.2
cowplot cowplot 1.1.3
dplyr dplyr 1.1.4
ggplot2 ggplot2 3.4.4
ggsurvfit ggsurvfit 1.0.0
ggthemes ggthemes 5.1.0
gt gt 0.10.1
gtools gtools 3.9.5
gtsummary gtsummary 1.7.2
here here 1.0.1
mice mice 3.16.0
survival survival 3.5-8
tictoc tictoc 1.2
Show the code
pander::pander(sessionInfo())

R version 4.4.0 (2024-04-24)

Platform: x86_64-pc-linux-gnu

locale: LC_CTYPE=C.UTF-8, LC_NUMERIC=C, LC_TIME=C.UTF-8, LC_COLLATE=C.UTF-8, LC_MONETARY=C.UTF-8, LC_MESSAGES=C.UTF-8, LC_PAPER=C.UTF-8, LC_NAME=C, LC_ADDRESS=C, LC_TELEPHONE=C, LC_MEASUREMENT=C.UTF-8 and LC_IDENTIFICATION=C

attached base packages: stats, graphics, grDevices, datasets, utils, methods and base

other attached packages: cowplot(v.1.1.3), tictoc(v.1.2), mice(v.3.16.0), gtools(v.3.9.5), ggthemes(v.5.1.0), gtsummary(v.1.7.2), gt(v.0.10.1), ggplot2(v.3.4.4), ggsurvfit(v.1.0.0), survival(v.3.5-8), dplyr(v.1.1.4), arrow(v.14.0.0.2) and here(v.1.0.1)

loaded via a namespace (and not attached): gtable(v.0.3.4), shape(v.1.4.6), xfun(v.0.41), htmlwidgets(v.1.6.4), lattice(v.0.22-5), simsurv(v.1.0.0), vctrs(v.0.6.5), tools(v.4.4.0), generics(v.0.1.3), tibble(v.3.2.1), fansi(v.1.0.6), pan(v.1.9), pkgconfig(v.2.0.3), jomo(v.2.7-6), Matrix(v.1.6-4), assertthat(v.0.2.1), lifecycle(v.1.0.4), farver(v.2.1.1), compiler(v.4.4.0), stringr(v.1.5.1), munsell(v.0.5.0), codetools(v.0.2-19), sass(v.0.4.8), htmltools(v.0.5.7), yaml(v.2.3.8), glmnet(v.4.1-8), nloptr(v.2.0.3), pillar(v.1.9.0), tidyr(v.1.3.1), MASS(v.7.3-60), broom.helpers(v.1.14.0), sessioninfo(v.1.2.2), iterators(v.1.0.14), rpart(v.4.1.23), boot(v.1.3-28.1), foreach(v.1.5.2), mitml(v.0.4-5), nlme(v.3.1-164), commonmark(v.1.9.1), tidyselect(v.1.2.0), digest(v.0.6.33), stringi(v.1.8.3), pander(v.0.6.5), purrr(v.1.0.2), labeling(v.0.4.3), forcats(v.1.0.0), splines(v.4.4.0), rprojroot(v.2.0.4), fastmap(v.1.1.1), grid(v.4.4.0), colorspace(v.2.1-0), cli(v.3.6.2), magrittr(v.2.0.3), utf8(v.1.2.4), broom(v.1.0.5), withr(v.3.0.0), scales(v.1.3.0), backports(v.1.4.1), bit64(v.4.0.5), rmarkdown(v.2.28), nnet(v.7.3-19), bit(v.4.0.5), lme4(v.1.1-35.1), evaluate(v.0.23), knitr(v.1.45), markdown(v.1.12), rlang(v.1.1.2), Rcpp(v.1.0.12), glue(v.1.6.2), xml2(v.1.3.6), renv(v.1.0.3), minqa(v.1.2.6), jsonlite(v.1.8.8) and R6(v.2.5.1)
Show the code
pander::pander(options('repos'))
  • repos:

    REPO_NAME
    https://packagemanager.posit.co/cran/latest