1  Data generation

Minimal example dataset

Author

Janick Weberpals

Published

November 1, 2024

2 Objective

The objective of this repository is to simulate a dataset with few missingness scenarios and evaluate bias for an unadjusted analysis, complete case analysis and analysis including imputed data after propensity score matching.

The first step involves the generation of a complete dataset with realistic distributions and associations between covariates, which is showcased here.

3 Data generation

  • The desired distributions as observed in the dataset.
  • Desired overall sample size: 10^{4}

3.1 Generate data using generate_data() function

We first create simulated data that approximates the covariate distributions in the observed empirical cohort.

Show the code
# data generating step
source(here::here("functions", "generate_data.R"))

cohort <- generate_data(
  seed = 42, 
  n_total = n_total
  )

cohort |> 
  glimpse()
Rows: 10,000
Columns: 17
$ X                      <int> 0, 0, 1, 0, 1, 1, 0, 1, 1, 0, 1, 0, 0, 1, 1, 0,…
$ Z2                     <dbl> 0.6153516, 0.6765416, 0.8913081, 0.6161119, 0.7…
$ U                      <int> 0, 0, 0, 1, 0, 0, 0, 1, 0, 0, 0, 0, 0, 0, 1, 0,…
$ c_ed                   <dbl> 0.546994461, -0.255923198, 2.759562171, 0.40503…
$ c_gnrc_cnt             <dbl> 13.692274, 5.448430, 7.034793, 16.137476, 6.140…
$ c_flu_vaccine          <int> 1, 1, 1, 1, 0, 1, 1, 1, 1, 0, 1, 1, 0, 0, 1, 0,…
$ c_foot_ulcer           <int> 0, 1, 0, 0, 0, 0, 0, 0, 0, 0, 0, 0, 0, 0, 0, 0,…
$ c_glaucoma_or_cataract <int> 1, 1, 1, 0, 1, 1, 1, 1, 1, 1, 1, 1, 1, 0, 1, 1,…
$ c_ischemic_stroke      <int> 0, 0, 1, 0, 0, 0, 0, 0, 0, 0, 0, 0, 0, 0, 0, 0,…
$ c_h2ra                 <int> 0, 0, 0, 0, 0, 0, 0, 0, 0, 0, 0, 0, 0, 0, 0, 0,…
$ c_acei                 <int> 1, 0, 1, 1, 0, 0, 0, 1, 0, 0, 1, 1, 0, 0, 0, 0,…
$ c_arb                  <int> 0, 1, 0, 0, 0, 0, 1, 1, 0, 0, 0, 0, 0, 0, 0, 0,…
$ c_statin               <int> 1, 1, 1, 0, 0, 0, 0, 1, 1, 1, 0, 1, 1, 0, 1, 1,…
$ c_spironolocatone      <int> 0, 0, 0, 0, 0, 0, 0, 0, 0, 0, 0, 0, 0, 0, 0, 0,…
$ dem_age                <dbl> 75.73247, 73.64546, 63.07144, 71.97991, 86.9776…
$ eventtime              <dbl> 10.00000000, 10.00000000, 10.00000000, 10.00000…
$ status                 <int> 0, 0, 0, 0, 0, 1, 0, 0, 1, 0, 0, 0, 1, 0, 0, 0,…
3.1.1 Table 1 by exposure

Display covariate distributions by exposure.

Show the code
cohort |> 
  tbl_summary(by = X) |> 
  add_difference()
Table 3.1: Covariate distributions by exposure.
Characteristic 0, N = 3,2131 1, N = 6,7871 Difference2 95% CI2,3 p-value2
Z2 0.85 (0.69, 1.00) 0.82 (0.66, 0.98) 0.03 0.02, 0.04 <0.001
U 366 (11%) 1,381 (20%) -9.0% -10%, -7.5% <0.001
c_ed 1.01 (-1.02, 2.94) 1.00 (-0.37, 2.33) -0.03 -0.15, 0.08 0.6
c_gnrc_cnt 9.8 (6.5, 13.1) 11.0 (7.6, 14.3) -1.2 -1.4, -0.95 <0.001
c_flu_vaccine 2,068 (64%) 4,340 (64%) 0.42% -1.6%, 2.5% 0.7
c_foot_ulcer 76 (2.4%) 337 (5.0%) -2.6% -3.4%, -1.8% <0.001
c_glaucoma_or_cataract 1,768 (55%) 3,573 (53%) 2.4% 0.27%, 4.5% 0.027
c_ischemic_stroke 297 (9.2%) 929 (14%) -4.4% -5.8%, -3.1% <0.001
c_h2ra 235 (7.3%) 450 (6.6%) 0.68% -0.42%, 1.8% 0.2
c_acei 998 (31%) 2,198 (32%) -1.3% -3.3%, 0.65% 0.2
c_arb 527 (16%) 1,258 (19%) -2.1% -3.7%, -0.53% 0.010
c_statin 1,964 (61%) 3,884 (57%) 3.9% 1.8%, 6.0% <0.001
c_spironolocatone 53 (1.6%) 179 (2.6%) -0.99% -1.6%, -0.38% 0.003
dem_age 75 (70, 80) 76 (71, 81) -0.99 -1.3, -0.68 <0.001
eventtime 10.00 (8.49, 10.00) 10.00 (6.61, 10.00) 0.35 0.23, 0.48 <0.001
status 913 (28%) 2,316 (34%) -5.7% -7.7%, -3.8% <0.001
1 Median (IQR); n (%)
2 Welch Two Sample t-test; Two sample test for equality of proportions
3 CI = Confidence Interval

3.1.2 Odds ratios

Odds rations for the strength of association between covariates and exposure.

Show the code
odds <- stats::glm(
  formula = paste0("X ~ ", paste0(names(cohort |> select(-c(X, eventtime, status))), collapse = " + ")),
  data = cohort,
  family = "binomial"
  )

odds |> 
  gtsummary::tbl_regression(exponentiate = T)
Table 3.2: Odds rations for the strength of association between covariates and exposure.
Characteristic OR1 95% CI1 p-value
Z2 0.54 0.45, 0.65 <0.001
U 2.01 1.77, 2.28 <0.001
c_ed 1.01 0.99, 1.03 0.5
c_gnrc_cnt 1.05 1.04, 1.06 <0.001
c_flu_vaccine 0.97 0.89, 1.06 0.5
c_foot_ulcer 2.18 1.70, 2.84 <0.001
c_glaucoma_or_cataract 0.89 0.82, 0.97 0.010
c_ischemic_stroke 1.57 1.36, 1.81 <0.001
c_h2ra 0.91 0.77, 1.07 0.2
c_acei 1.05 0.95, 1.15 0.3
c_arb 1.16 1.04, 1.30 0.010
c_statin 0.85 0.78, 0.93 <0.001
c_spironolocatone 1.54 1.13, 2.12 0.007
dem_age 1.02 1.01, 1.02 <0.001
1 OR = Odds Ratio, CI = Confidence Interval

3.2 Generate outcome

Generate the outcome with a desired event rate of ~40 events/1,000 person-years of follow-up.

Show the code
# event-rate per 1000 person-years of follow-up
# in original data: ~40 events per 1000 person-years
event_rate_per_1000py <- round(sum(cohort$status)/sum(cohort$eventtime)*1000, 2)
  • Resulting/simulated event rate per 1,000 person-years: 39.26

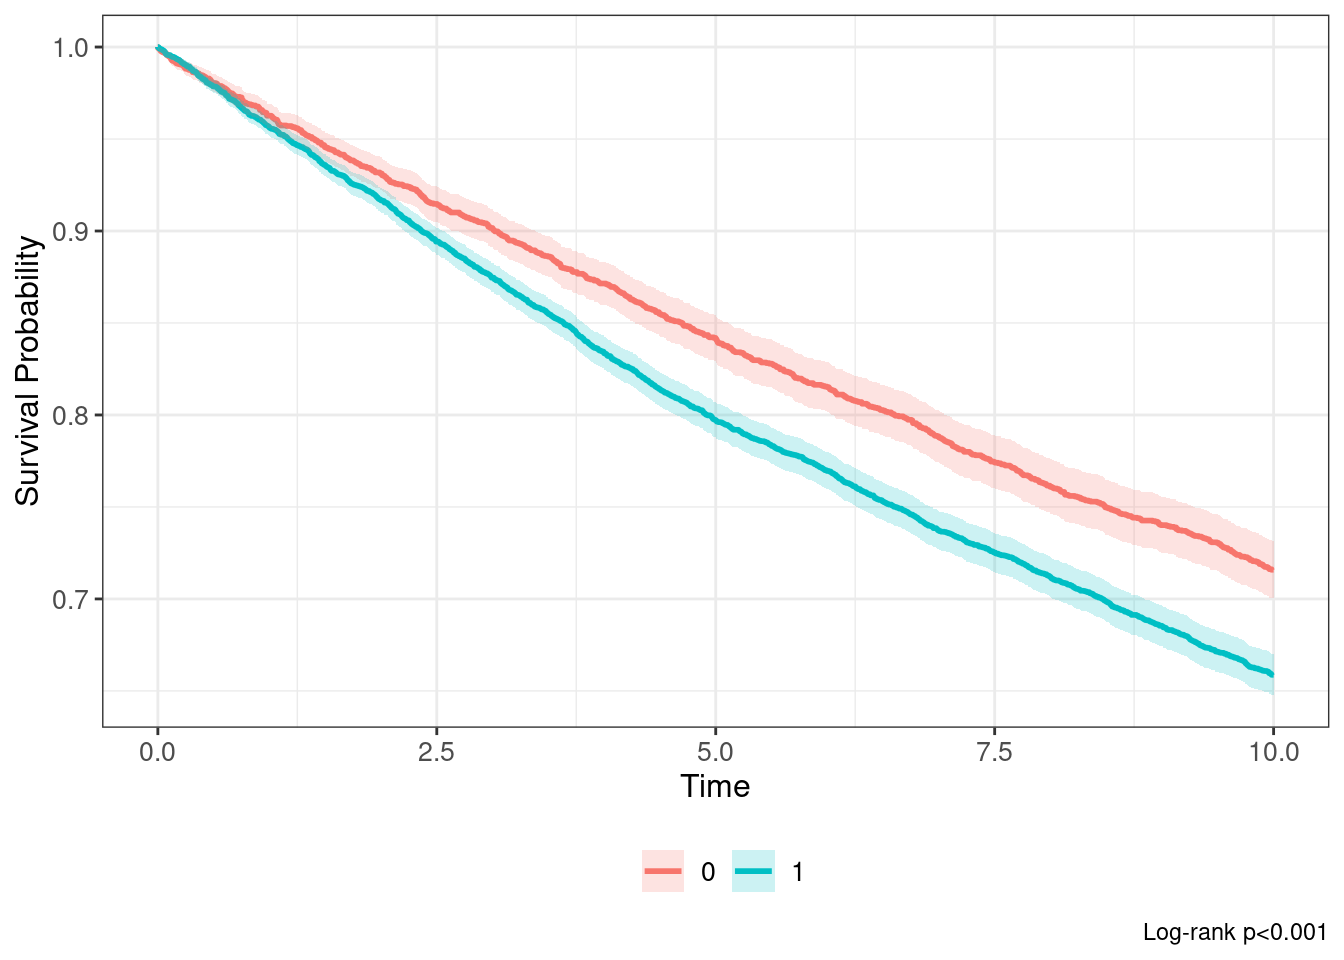
3.3 Survival

Show the code
km_exposure <- survfit2(formula = survival::Surv(eventtime, status) ~ X, data = cohort)

ggsurvfit(
  x = km_exposure, 
  type = "survival",
  linewidth = 1
  ) +
  add_confidence_interval() +
  add_pvalue(caption = "Log-rank {p.value}")
Figure 3.1: Kaplan-Meier plot (unadjusted) by exposure.

Next, let’s compute the univariate and multivariate beta coefficients (hazard ratios [HR]).

  • Beta unadjusted:
Show the code
cox_fit_unadjusted <- survival::coxph(formula = Surv(eventtime, status) ~ X, data = cohort)

cox_fit_unadjusted |>  
  gtsummary::tbl_regression(exponentiate = T)
Table 3.3: Univariate hazard ratio.
Characteristic HR1 95% CI1 p-value
X 1.25 1.16, 1.35 <0.001
1 HR = Hazard Ratio, CI = Confidence Interval
  • Beta adjusted:
Show the code
lhs <- "Surv(eventtime, status)"
rhs <- paste0(colnames(cohort |> select(-c(eventtime, status))), collapse = " + ")
cox_form <- as.formula(paste0(lhs, "~", rhs))

cox_fit_adjusted <- survival::coxph(formula = cox_form, data = cohort)

cox_fit_adjusted |>  
  gtsummary::tbl_regression(exponentiate = T)
Table 3.4: Multivariate hazard ratio.
Characteristic HR1 95% CI1 p-value
X 1.03 0.96, 1.12 0.4
Z2 5.42 4.66, 6.31 <0.001
U 1.43 1.32, 1.56 <0.001
c_ed 1.04 1.02, 1.05 <0.001
c_gnrc_cnt 1.08 1.07, 1.09 <0.001
c_flu_vaccine 0.83 0.77, 0.89 <0.001
c_foot_ulcer 2.07 1.80, 2.38 <0.001
c_glaucoma_or_cataract 0.77 0.72, 0.82 <0.001
c_ischemic_stroke 1.51 1.37, 1.66 <0.001
c_h2ra 0.67 0.57, 0.78 <0.001
c_acei 1.36 1.26, 1.46 <0.001
c_arb 1.40 1.29, 1.52 <0.001
c_statin 0.85 0.79, 0.91 <0.001
c_spironolocatone 1.67 1.38, 2.03 <0.001
dem_age 1.05 1.04, 1.05 <0.001
1 HR = Hazard Ratio, CI = Confidence Interval

3.4 Session info

Script runtime: minutes.

Show the code
pander::pander(subset(data.frame(sessioninfo::package_info()), attached==TRUE, c(package, loadedversion)))
  package loadedversion
arrow arrow 14.0.0.2
dplyr dplyr 1.1.4
ggplot2 ggplot2 3.4.4
ggsurvfit ggsurvfit 1.0.0
gtsummary gtsummary 1.7.2
here here 1.0.1
simsurv simsurv 1.0.0
survival survival 3.5-8
tibble tibble 3.2.1
Show the code
pander::pander(sessionInfo())

R version 4.4.0 (2024-04-24)

Platform: x86_64-pc-linux-gnu

locale: LC_CTYPE=C.UTF-8, LC_NUMERIC=C, LC_TIME=C.UTF-8, LC_COLLATE=C.UTF-8, LC_MONETARY=C.UTF-8, LC_MESSAGES=C.UTF-8, LC_PAPER=C.UTF-8, LC_NAME=C, LC_ADDRESS=C, LC_TELEPHONE=C, LC_MEASUREMENT=C.UTF-8 and LC_IDENTIFICATION=C

attached base packages: stats, graphics, grDevices, datasets, utils, methods and base

other attached packages: arrow(v.14.0.0.2), here(v.1.0.1), gtsummary(v.1.7.2), ggplot2(v.3.4.4), ggsurvfit(v.1.0.0), survival(v.3.5-8), dplyr(v.1.1.4), simsurv(v.1.0.0) and tibble(v.3.2.1)

loaded via a namespace (and not attached): gtable(v.0.3.4), xfun(v.0.41), htmlwidgets(v.1.6.4), lattice(v.0.22-5), vctrs(v.0.6.5), tools(v.4.4.0), generics(v.0.1.3), fansi(v.1.0.6), pkgconfig(v.2.0.3), Matrix(v.1.6-4), assertthat(v.0.2.1), gt(v.0.10.1), lifecycle(v.1.0.4), compiler(v.4.4.0), farver(v.2.1.1), stringr(v.1.5.1), tictoc(v.1.2), munsell(v.0.5.0), htmltools(v.0.5.7), sass(v.0.4.8), yaml(v.2.3.8), pillar(v.1.9.0), tidyr(v.1.3.1), ellipsis(v.0.3.2), broom.helpers(v.1.14.0), sessioninfo(v.1.2.2), commonmark(v.1.9.1), tidyselect(v.1.2.0), digest(v.0.6.33), stringi(v.1.8.3), purrr(v.1.0.2), pander(v.0.6.5), labeling(v.0.4.3), forcats(v.1.0.0), splines(v.4.4.0), labelled(v.2.12.0), rprojroot(v.2.0.4), fastmap(v.1.1.1), grid(v.4.4.0), colorspace(v.2.1-0), cli(v.3.6.2), magrittr(v.2.0.3), utf8(v.1.2.4), broom(v.1.0.5), withr(v.3.0.0), scales(v.1.3.0), backports(v.1.4.1), bit64(v.4.0.5), rmarkdown(v.2.28), bit(v.4.0.5), hms(v.1.1.3), evaluate(v.0.23), knitr(v.1.45), haven(v.2.5.4), markdown(v.1.12), rlang(v.1.1.2), Rcpp(v.1.0.12), glue(v.1.6.2), xml2(v.1.3.6), renv(v.1.0.3), jsonlite(v.1.8.8) and R6(v.2.5.1)

Show the code
pander::pander(options('repos'))
  • repos:

    REPO_NAME
    https://packagemanager.posit.co/cran/latest